The Theory of Related-ivity: Segment VIII
Wednesday, April 1, 2026 - 09:30
The Theory of Related-ivity:
A History and Analysis of the Best Related Work Hugo Category
by Heather Rose Jones
(This is a serialized article exploring the history of the Best Related Work Hugo category in its various names and versions. If you’ve come in at the middle, start here.)
Contents
Part 3: Historic Trends
3.2 Media
3.2.1 Introduction
Part 3: Historic Trends
3.2 Media
3.2.1 Introduction
Categorizing work by Media has to do with the format of the work rather than its content. The basis for classifying the various Media types is given in the Categorization Process section in the Media chapter. The discussions below of individual Media types will include any trends or observations specific to each format. This introductory section examines large-scale trends. The analysis is the most straightforward and least interesting with regard to changes over the various eras, as the category names Non-Fiction Book and Related Book, as well as the eligibility definitions, strongly influenced nominations to be restricted to physical print Books.
If one accepts Convention Ephemera (souvenir program books, restaurant guides, etc.) to fall conceptually within “physical print books," then all Non-Fiction Book nominees are, in essence, Books (1 Finalist is Convention Ephemera), and all Winners in this era are Books. In the Related Book era, all nominees are, in essence, Books (1 Finalist and 1 Long List work are Ephemera) with one exception: a Periodical nominated in 2007 that did not make the Long List.[1] All Related Book Winners were Books.
Therefore, the interest in this part of the analysis comes from tracking changes in Media across the Related Work era. Two data sets are compared: Finalists and Long Lists. There is only one year (2010) during the Related Work era where additional nominees were listed (N=23).
Taking the era as a whole, the Finalist and Long List proportions are highly similar, though some rarer Media formats appear only in the Long Lists. Table 3 shows percentages ordered by popularity in the Long List data.[2] The table also includes percentages for Winners of the category.[3]
Table 3: Proportions of Media Types

So in terms of format, the Finalists appear to be closely representative of what is nominated as a whole. This distribution also suggests that for any formats outside the top five or six, observations are likely to be anecdotal only. Proportions of Winners are also roughly representative of the overall proportions of nominees, with the caveat that only Books appear more than once as a Winner.[4] On a proportional basis, we might expect there to have been at least one Video Winner and would not expect a Speech Winner, but otherwise, interest in the Media format as a whole is reflected in the voting outcome.
To examine the trends over time, the distribution by year is shown in Figures 10 and 11 and Tables 4 and 5, where the details may be easier to see due to the number of categories.
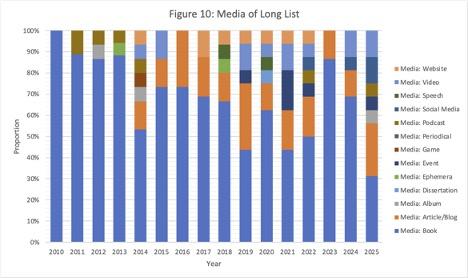

Table 4: Media Types for Long List
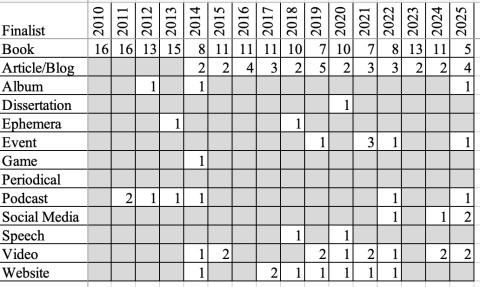
Table 5: Media Types for Finalists

We can see that it took a while for nominators to begin engaging with the potential range of Media beyond Books, with Podcasts being the first expansion. (The full data set for 2010 includes one Podcast, with all other nominees being Books.) It makes sense to do the primary analysis on the Long List and then compare the Finalists.
Within the Long Lists, Books dominate the Media formats, falling below 50% in only three years, and falling below 67% in only five years. However, there is a trend of Books increasingly being displaced by other Media formats as time progresses. The lowest presence is 33% in 2025 (the last year of analysis).
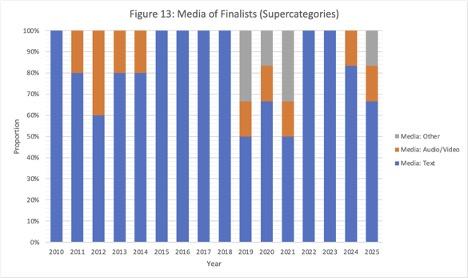
Before moving on to the more detailed analysis, it might make sense to take a slightly different, and higher-level, view. The second most prevalent Media type is the Blog/Article group—that is, textual works that are shorter than Books or that are published on the web rather than in hardcopy format. Combining the numbers into three super-sets—textual works, audio or video works, and other—the trends can be seen in Figure 12 and Figure 13. (These same graphs also work to analyze the most common versus less common formats, as the Audio/Video and Other groups are also significantly less common.)

Here it’s even more clear that the expanded scope of Media formats has not dislodged textual works from dominance. Text is never less than 50% of the Long List and rarely less than 75%, though again there is a gradual downward trend across the era. The “Other” Media group takes longer to begin appearing in the Long List, but once present, it vies with Audio/Video for second place.
This dominance is even more striking among Finalists, with textual works never being less than 50% and filling all the Finalist slots in 7 years out of the 16. Audio/Video formats are a regular presence, but there is a cluster of years (2019-2021) when Other Media types are strongly represented among Finalists.
Returning to the more finely-grained analysis, there has been an overall (though erratic) increase in the number of different Media formats represented in the Long List with a similar, though naturally lower, increase for Finalists (Figure 14).

Long List diversity of format increased steadily to 2014 when 7 formats were represented (tied for maximum with 2022 and 2025). This fell significantly in the following few years (2015-2017, which include the two Puppy years), then increased again, with the anomaly being the low diversity of format in 2023 (when Worldcon was in China). While a rigorous analysis hasn’t been performed, the non-textual formats in the Long List appear to cluster toward the bottom of the nominations, so it may be that anything that disrupts normal nomination patterns is more likely to push out works in non-text formats. This is speculation.
Finalists are relatively more diverse in format than the Long List, with only two years in which only a single format was represented (Books, as one might guess).[5] There are 3 years where the 6 Finalists are drawn from 4 different formats, with Book and Video being constants, and Article/Blog, Event, and Website occurring in 2 of the years each (closely corresponding to our 6 most frequent Media formats overall).
As noted previously, diversity of Media increases gradually, but certain types begin appearing at different times. Interestingly, the Article/Blog format, though second most popular overall, doesn’t show up in the Long List until the fifth year of the era (2014), though it appears continuously from then on, and with at least 2 works each year. The earliest format expansion is Podcast, appearing in the 2nd through 5th years of the era, then sporadically later. There are several specific features of Podcast appearances that affect their appearance in Best Related and the dominance of one Podcast in this Media format. This is discussed in the Overlapping Categories section, Fancast chapter. Video and Website both appear frequently, but not continuously, starting in 2014. Unlike Podcast, Video works are not dominated by a single repeating show, although some works are part of a Series by the same creator, where only one or two episodes were nominated. Website falls somewhat between the two patterns, with one repeating work accounting for almost half the nominations for this format. The latest addition to the range of formats appearing in the Long Lists is Social Media, first appearing in 2022.
Of the 8 Media formats appearing as Finalists, 4 (Book, Article/Blog, Album, Podcast) appear in the earlier part of the Related Work era (2010-2018) and may also occur later, while 4 (Event, Speech, Video, Website) appear first in 2019-2020 and may also occur later. Looking at both Finalists and Long Lists, 2019 feels like a tipping point for expanding the diversity of formats.
Conclusions
Overall, although there are a wide variety of Media formats appearing in the data, the majority appear rarely, and text formats (long form and short form) dominate the data. Non-Book formats took a few years to be embraced by nominators, with some being adopted earlier than others. When assessing the Related Work period as a whole, Media formats appear as Finalists roughly in the same proportions that they appear in the Long List, and—within the constraints of the numbers—Winners are also roughly proportional to presence in the Long List. That said, when examined on a year-by-year basis, there is an overall trend for non-Book formats, or non-text formats in general, to become slightly more prevalent as time goes on, with non-text formats never exceeding 50% of the Long List or Finalists. And even in recent years, there have been multiple times when the Finalists were entirely text works.
The remainder of the Media section will examine each Media format and discuss any interesting features of its frequency and appearance. For rarely-occurring formats, the discussion will focus on the factors behind the specific works that appear, whereas for more common formats the analysis will review other features of the format that may have changed over time.
(Segment IX will cover Part 3 Historic Trends, Section 3.2 Media, Chapters 3.2.2-3.2.14.)
[1]. This is the only work in the entire database categorized as a Periodical. It might reasonably have been classified as a Book but see the Category discussion for details.
[2]. Note that one format (Periodical) does not occur during the Related Work era, as it has only a single instance in the entire dataset.
[3]. 7% represents a single Winner. Thus, only Book has had more than one Winner.
[4]. During two years no award was given, due to voter response to the Sad Puppy slate nominations dominating the category. For this purpose, % Winners are calculated relative to total winning works, not number of years.
[5]. “Relatively more diverse” means “number of different Media types compared to the number of nominees.”
Major category: